Every operations department runs on fragile, homebrewed Excel models.
You know the ones. An 8-megabyte workbook built by an inventory analyst in 2021 who left the company two years ago. Half the cells are hardcoded in bright yellow. The moment someone touches Column G, the macro crashes. Yet your dispatch coordinators open that exact sheet six times every morning just to calculate basic container fills.
I wanted to replace three of those internal tools with lightweight web calculators for months. But our internal software engineering queue had an eight-month backlog. To our dev team, an internal freight surcharge calculator is a low-priority ticket.
To our shipping desk, it is a thirty-minute headache every single day.
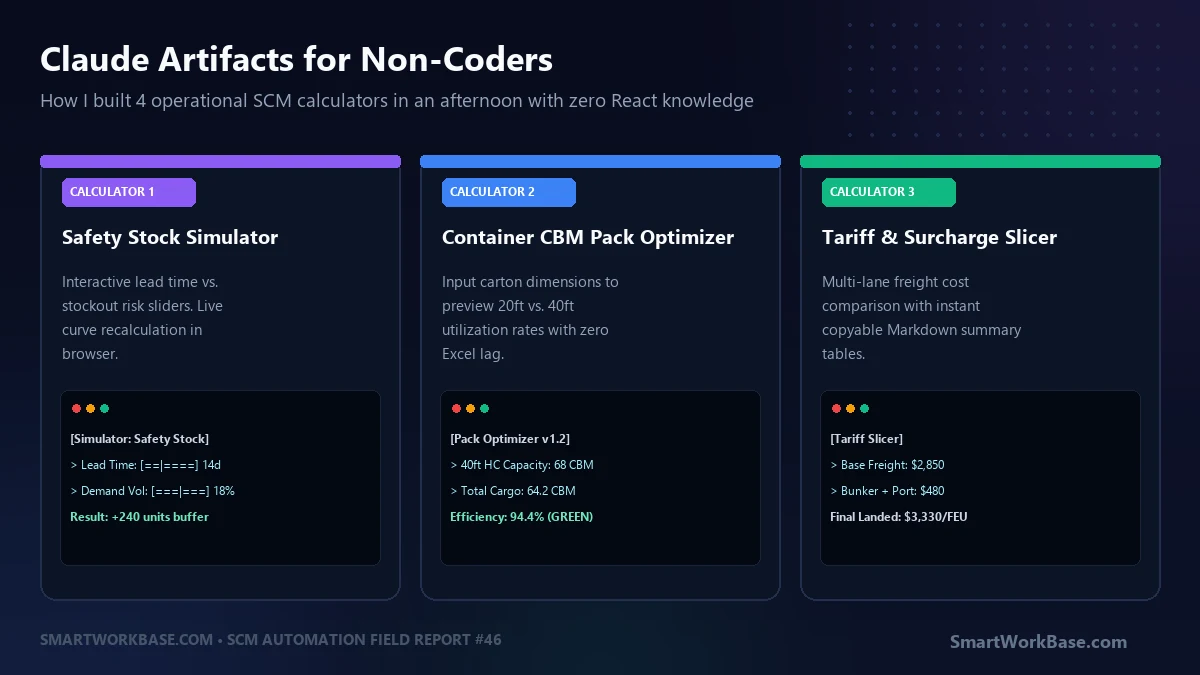
Last Tuesday, I tried a different approach. I spent four hours with Claude 3.5 Sonnet using its split-screen Artifacts capability. By 5:00 PM, I had four fully responsive interactive tools running directly in my browser. No local development environment. No GitHub deployment pipeline. Just pure operational logic translated into working web apps.
What Claude Artifacts Actually Does for Business Teams
If you haven’t used Artifacts, think of it as an instant prototyping sandbox. In standard chat interfaces, when you ask an LLM for a calculation tool, it dumps 300 lines of raw React or HTML code into the chat text. You have to copy the code, paste it into an IDE, install dependencies, and run a local web server to see if it even works.
Artifacts eliminates that friction. Claude renders interactive React prototypes directly in a live right-hand panel while keeping your conversation on the left. You see the sliders move. You click the buttons. You test edge cases in real time.
If a calculation is off by 2%, you don’t edit JavaScript. You tell Claude: “Add an 8% drayage buffer when the destination port is Long Beach,” and the live interface updates in four seconds.
The 4 Operational Calculators I Built
1. The Dynamic Safety Stock Simulator
Most planners calculate safety stock using static Excel formulas like =Z*STDEV*SQRT(LeadTime). The problem? Non-technical stakeholders cannot visualize how a supplier’s shipment variability impacts warehouse stockout risk.
I had Claude build a visual simulator with two interactive sliders: Lead Time Variability (Days) and Target Service Level (90% to 99%). As you drag the sliders, a dynamic bell curve adjusts in real time, showing the exact inventory buffer required in units and dollars. In our Thursday planning review, this single tool cut our lead-time debate from forty minutes down to six.
2. Container CBM & Pallet Pack Optimizer
Our dispatch team often debates whether an incoming order fits into a standard 40ft High Cube container (approx. 68 usable CBM) or requires an additional 20ft box. Claude generated a clean three-column form: enter carton dimensions (L x W x H in cm), carton count, and pallet orientation. It calculates total CBM, weight utilization, and highlights a green or red capacity bar with one-click Markdown summary generation.
3. Freight Tariff & Surcharge Slicer
Ocean freight rates change weekly, but carriers love adding variable fees: bunker adjustment factors (BAF), peak season surcharges (PSS), and chassis split fees. This calculator lets any coordinator select an origin port, paste the raw carrier quote, and instantly see the clean all-in landed cost per forty-foot equivalent unit (FEU) alongside a percentage breakdown.
4. Expedited Freight ROI Break-Even Matrix
When a factory shuts down, air freighting 500 units costs $12,000. Is it worth it? This micro-tool compares air freight expense directly against customer contractual delay penalties per day. It highlights the exact break-even delivery date where air freight saves money versus standard ocean transit.
The Copy-Paste Prompt Blueprint for Operational Tools
The secret to getting clean, bug-free calculators from Claude is avoiding generic prompts like “Build me a container calculator.” You need to enforce an operational UI schema that prioritizes inputs, validation guards, and clear outputs:
Feed this exact prompt structure into Claude 3.5 Sonnet to build an interactive operational tool:
You are an expert full-stack developer specializing in building lightweight, interactive operational calculators for non-technical supply chain and business teams.

Build a standalone React artifact for: [INSERT CALCULATOR NAME, e.g. Container CBM Optimizer].

STRICT DESIGN & FUNCTIONAL RULES:
1. Architecture: Single-file React component using Tailwind CSS and lucide-react icons.
2. Layout: Split view — Left side for input controls (sliders + clean number fields), Right side for instant results and visual progress/capacity bars.
3. Input Guards: Prevent negative numbers, NaN outputs, and division-by-zero errors. Set realistic operational default values.
4. Export Utility: Include a "Copy Markdown Summary" button that generates a clean 4-line text summary ready to paste directly into Slack, Teams, or an email.
5. Visual Hierarchy: Use clear badges (Green for within capacity, Amber for 85-95%, Red for overload).

CORE FORMULAS TO IMPLEMENT:
- Formula 1: [Define calculation, e.g. Total_CBM = (Length * Width * Height / 1,000,000) * Quantity]
- Formula 2: [Define constraint, e.g. Capacity_Pct = (Total_CBM / 68.0) * 100]

Render this as an interactive Artifact immediately.
Tool Comparison: Excel vs. Claude Artifacts vs. Internal IT Dev
| Metric | Legacy Excel Model | Claude Artifact | Internal IT Project |
|---|---|---|---|
| Build Time | 2–4 hours | 10–20 minutes | 3–6 months |
| User Interface | Cluttered cells | Clean web app | Custom enterprise UI |
| Formula Vulnerability | High (accidental overwrite) | Zero (locked frontend logic) | Zero (backend API) |
| Cost to Build | $0 | $20/mo Claude Pro | $15,000+ internal budget |
I still use Excel every day for messy data exploration and historical pivot tables. But for operational decisions that require three inputs and an immediate green-or-red answer, handing your team an interactive artifact is ten times cleaner than emailing another versioned spreadsheet.
Common questions
How do I share a Claude Artifact with colleagues who don’t have a Claude account?
Claude has a direct “Publish Artifact” button in the top right corner of the artifact window. When clicked, it generates a public, view-only web link. Anyone on your team can open the link in any mobile or desktop browser and use the interactive sliders without logging in or paying for an account. Alternatively, you can ask Claude to export the tool as a single self-contained HTML file and host it on an internal company intranet.
Does an Artifact save data to a database?
No. By design, frontend React artifacts run strictly client-side in the user’s browser memory. When a team member closes the browser tab, the inputs reset to default. For micro-calculators, this is an advantage: zero security audits, no database credentials, and zero risk of storing confidential company metrics on third-party servers.
What happens if the calculation logic has an error?
You must verify the underlying math against your own manual calculation before sharing. Claude writes great interface code, but it occasionally makes subtle mathematical order-of-operation mistakes (such as misplacing parentheses in square-root lead-time formulas). Always run three test scenarios through the prototype and check the numbers before rolling it out to your team.