🔄 Last updated: August 23, 2026
⚡ Key Takeaways
In today’s fast-paced digital landscape, text-heavy content often fails to capture immediate audience attention. Visual storytelling is no longer optional—it is essential. Learning how to create viral infographics with AI allows creators, marketers, and SaaS founders to turn complex data into captivating visual assets in a fraction of the time.
According to research by HubSpot and Content Marketing Institute, visual posts receive 94% more views and are 30 times more likely to be read from start to finish than plain text articles. In this step-by-step guide, we walk you through the exact 5-minute automated workflow to engineer viral visual graphics.
The 5-Step AI Infographic Creation Workflow
Traditional graphic design requires hours of manual formatting, alignment, and asset hunting. By integrating modern generative AI into your workflow, you can streamline the entire visual production process into five distinct stages.
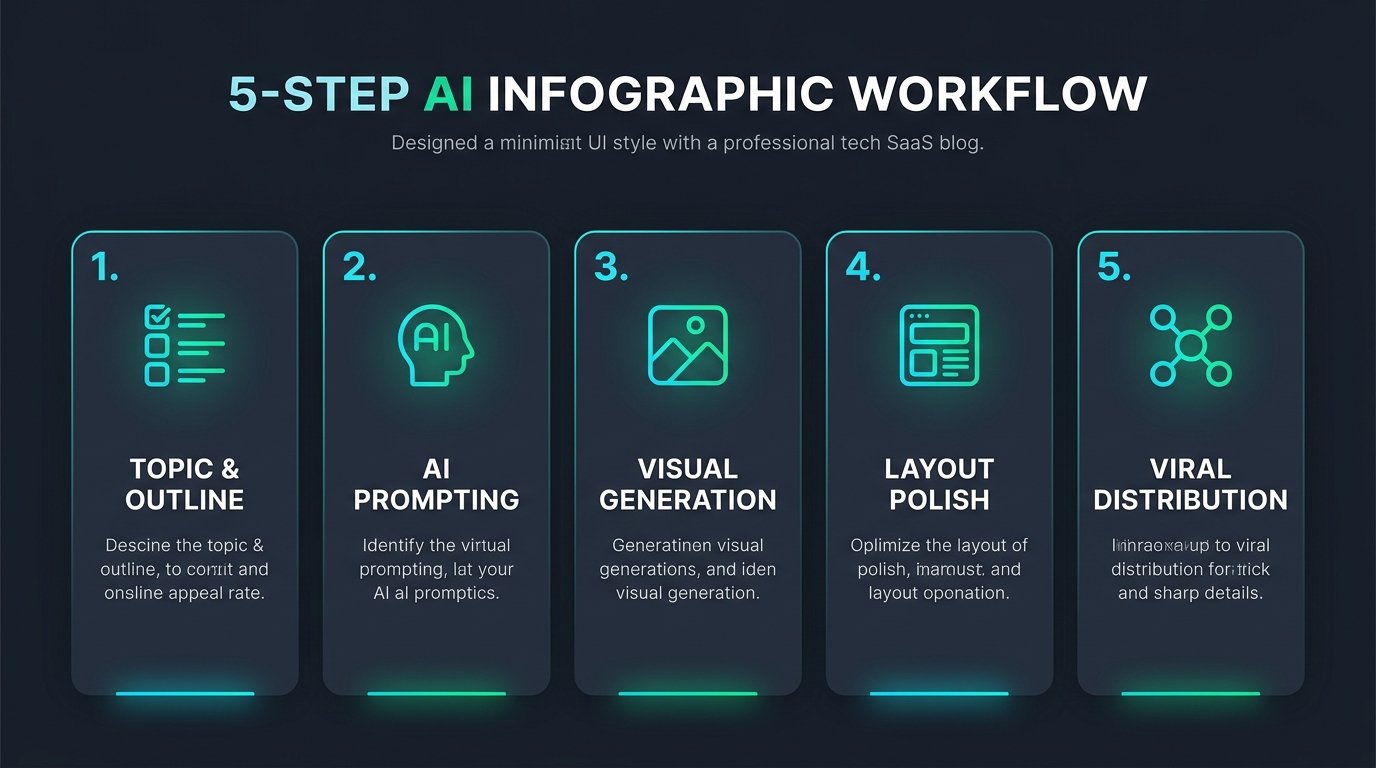
Figure 1: The automated 5-step framework for AI infographic generation.
- Topic & Structural Outline: Extract key metrics and outline 3–5 bite-sized takeaways using LLMs like ChatGPT or Claude.
- AI Prompt Engineering: Craft precise image generation prompts specifying layout geometry, color palettes, and visual hierarchy.
- Visual Generation: Synthesize high-resolution visual cards using Midjourney v6, DALL-E 3, or specialized AI tools.
- Layout Polish & Typography: Add precise branding overlay, logos, or localized text using lightweight design editors.
- Viral Distribution: Publish on Pinterest, LinkedIn, and blogs to trigger organic traffic flywheels.
💡 Pro-Tip: Integrating Automation into Your Tech Stack
Just as you can automate content creation, you can streamline your entire publishing process. Check out our detailed guide on 7 Best AI Tools for Daily Workflow Automation in 2026 to automate your content distribution seamlessly.
Interactive Prompt Template: Viral 4-Part AI Infographic Prompt Formula
💡 Click “Copy Prompt” and paste directly into your favorite AI tool.
🛠️ Click to Expand: 5-Minute High-Converting Infographic Checklist
✅ Step 1: Choose 1 core insight with maximum 3~4 sequential steps (avoid visual clutter).
✅ Step 2: Use the 4-part prompt formula: Style + Structure + Color Palette + Aspect Ratio (`–ar 16:9`).
✅ Step 3: Open in Canva or Figma to overlay high-contrast bold typography (minimum 24pt for mobile).
✅ Step 4: Export in WebP format (quality 85) to ensure sub-second page loading speed.
✅ Step 5: Add descriptive ALT text for 100% SEO accessibility and image search ranking.
Mastering the Master AI Infographic Prompt Formula
The secret to generating clean, readable infographics lies in structured prompt architecture. Asking an AI model to “make an infographic about AI tools” usually results in distorted, illegible text artifacts. Instead, use a segmented modular prompt structure.
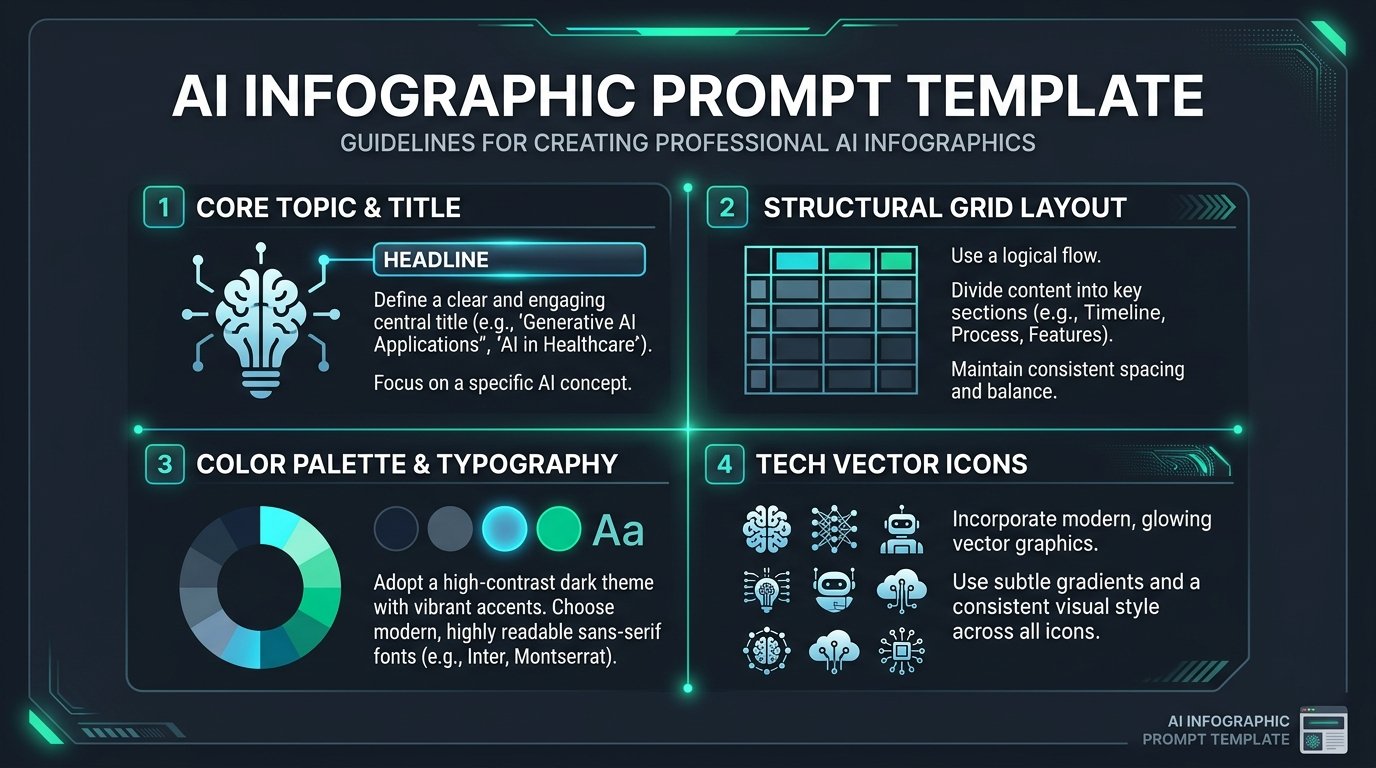
Figure 2: The universal modular prompt engineering template for infographic creation.
The Modular Prompt Engineering Template
Copy and adapt this standardized prompt formula for Midjourney, Flux, or NanoBanana visual engines:
A sleek, high-contrast infographic card titled "[YOUR TITLE HERE]".
Features clean visual layout with readable English typography:
1. "[KEY POINT 1]", 2. "[KEY POINT 2]", 3. "[KEY POINT 3]".
Minimalist dark slate UI styling, glowing cyan and emerald accents,
crisp vector icons, professional tech SaaS blog visual, 4k resolution --ar 16:9
Top 3 AI Infographic Tools Compared (2026 Edition)
Selecting the right tool depends on your team’s specific requirements for speed, customizability, and data fidelity. Here is how the top three solutions rank in 2026:
1. Canva AI (Magic Design)
⭐ Best for Speed & Ease
Canva’s Magic Design suite transforms raw text outlines into fully customizable vector templates instantly. It allows real-time drag-and-drop editing of text labels, ensuring 100% typo-free graphics.
Best Feature: Instant vector editing and automated brand kit color matching.
2. Midjourney v6 / NanoBanana Visuals
🎨 Best for Creative Art Direction
For stunning, high-impact aesthetic cards with modern dark UI styling, glowing neon accents, and futuristic icons, Midjourney v6 delivers unparalleled visual quality for tech blogs.
Best Feature: Photorealistic vector aesthetics and 4K rendering capabilities.
3. Piktochart AI
📊 Best for Complex Data & Charts
Piktochart AI excels at converting raw CSV files, spreadsheets, and complex statistical data into clean, enterprise-ready infographics, bar charts, and pie diagrams.
Best Feature: Direct CSV import and dynamic data chart generation.
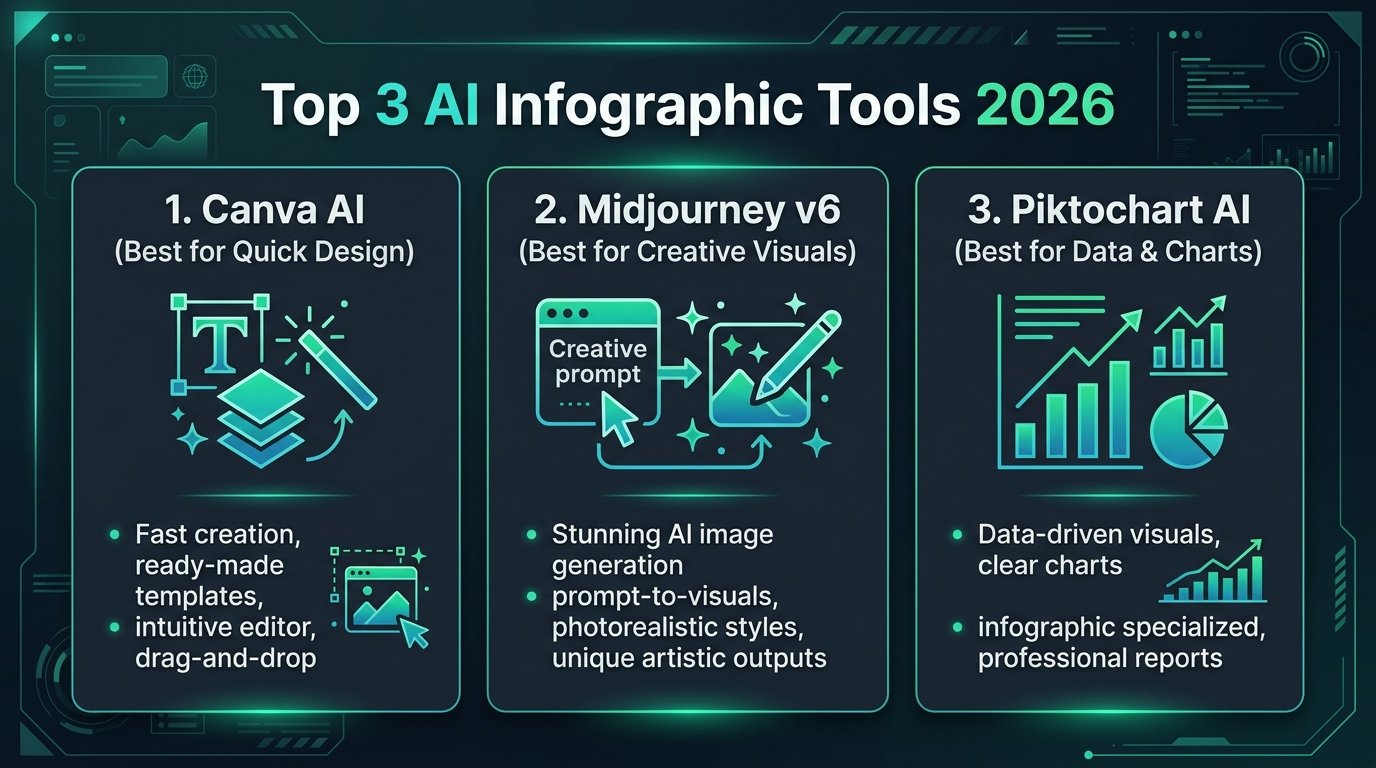
Figure 3: Feature comparison matrix for leading AI infographic generators.
Feature Comparison Matrix
| Feature | Canva AI | Midjourney v6 | Piktochart AI |
|---|---|---|---|
| Generation Speed | ⚡ Instant (< 1 min) | ⏱️ Fast (2 mins) | ⚡ Instant (< 2 mins) |
| Text Editability | 100% Vector Editable | Raster Image Only | 100% Vector Editable |
| Visual Quality | Clean Corporate | 🔥 Ultra Premium / Futuristic | Professional Editorial |
| Data Import (CSV) | Basic | None | Advanced Auto-Charting |
💡 Pro-Tip: Knowledge Management for Content Creators
Storing your visual prompts and design assets in a structured second brain is vital. Read our comparison on Notion AI vs ChatGPT for Note-Taking to build your personal prompt database.
Frequently Asked Questions (FAQ)
Q1: Can AI generate error-free text inside infographics?
While Midjourney v6 and DALL-E 3 have significantly improved text rendering, occasional spelling artifacts occur. For 100% accurate typography, generate the visual background with AI and overlay text using Canva or Figma.
Q2: What is the ideal aspect ratio for Pinterest visual infographics?
For Pinterest viral growth, vertical aspect ratios like 2:3 (1000x1500px) or 16:9 horizontal cards for web blog headers yield the highest engagement rates.
Q3: Are AI-generated infographics copyrighted?
In most jurisdictions, pure AI outputs are in the public domain. However, graphics customized with unique brand layouts, original data points, and custom text overlays qualify for copyright protection.
Q4: How do infographics impact SEO rankings?
Infographics dramatically increase reader dwell time (a core Google ranking factor) and act as high-value backlink magnets when shared across external blogs and news outlets.
For further reading on visual media guidelines and digital marketing benchmarks, refer to resources provided by the Gartner Research Group and MIT Technology Review.
Stop Paying for Midjourney! Free AI Infographic Generator Tested
Discover how Recraft AI and Ideogram v2 generate zero-typo vector infographics completely free without a $60/mo Midjourney subscription.